

PropvizPropviz

Singapore private property research

A home is priced by everything around it

The MRT lines, schools, hawker centres and supermarkets nearby are what you live with every day, and what the market pays for. Propviz maps them around every condo, then puts its price on one yardstick, so you can see what you're really paying for.

Upgrading from HDB? Plan your upgrade from your own block →

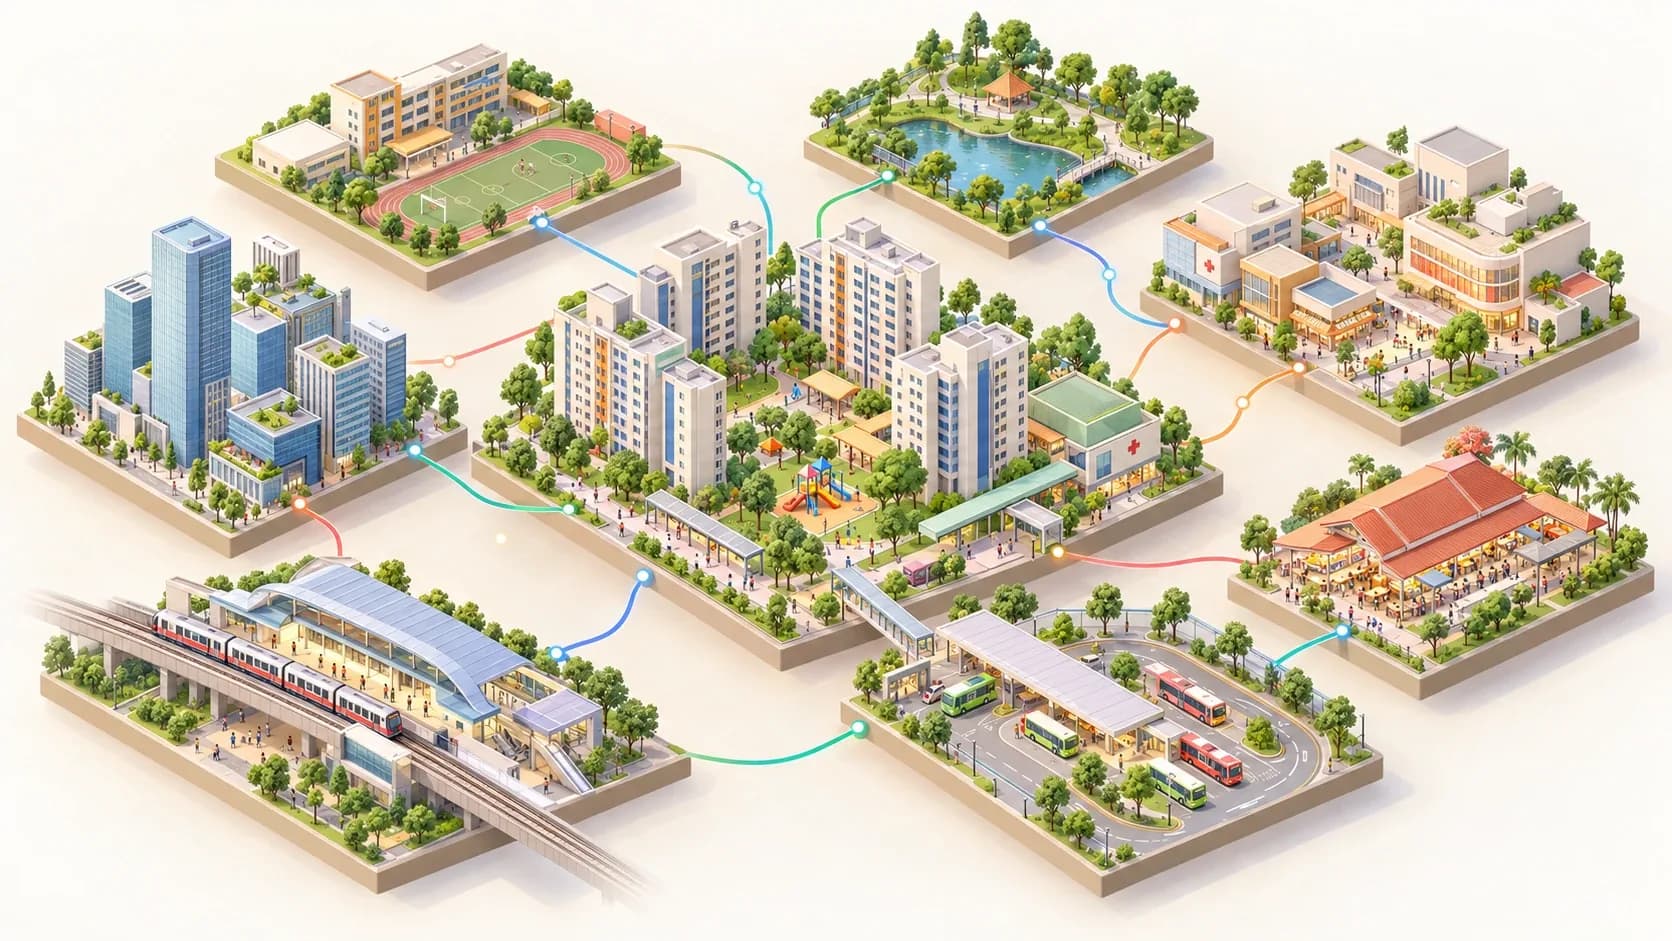
What's around a home is part of what it's worth. The numbered threads are the ones Propviz measures.

Livability, then price

How Propviz reads a home

  1. The home, and the estate around it

    Each project's price history month by month, and how many HDB flats nearby reach MOP each year. Upgrading? Start from your own block.

  2. MRT, line by line

    The nearest station on every rail line, with the walk in minutes, not just the closest dot on a map.

    Free on every plan

  3. Schools within reach

    Every school on the map, and the nearest ones to each project with their distances.

    Nearest three with Pro

  4. Hawker centres

    Where you'll eat most days. Every hawker centre on the map, and how far each project is from its nearest.

    Nearest three with Pro

  5. Supermarkets and daily needs

    The weekly shop, measured the same way: every supermarket on the map, nearest first from each project.

    Nearest three with Pro

Where the threads meet

Then, the price

Livability only matters next to what the market pays for it. Propviz sets each project's price beside everything around it:

  • PSF on one yardstick. Older projects restated on URA's 2023 harmonised area basis, so a 2019 launch and a 2025 launch compare fairly.
  • Where its price sits. A project's PSF against the rest of its district.
  • Who it competes with. The new launches and ECs nearby, chasing the same buyers.

Put together, you can judge for yourself whether what's around a home is already in its price.

See it on the map →

Which one are you?

Investors and landlords

Find value before the market does

Comparing projects means stitching together transaction exports in spreadsheets, on PSFs that aren't even measured the same way.

Screen every project by district, tenure and property type on harmonised PSF, and see where prices are moving across the market.

Screen the market →

HDB upgraders

Know what your flat can fund

Your next home depends on what your flat will fetch and when it reaches MOP, and every listing tells a different story.

Start from your own block: resale evidence for your town and flat type, worked out in your browser, and the condos and ECs within reach.

Plan your upgrade →

Home buyers

Pay a fair price for the right home

An asking price says little about what a project actually trades at, or what's around it.

See each project's price history, where its PSF sits in its district, and the MRT stations, schools and hawker centres nearby.

Explore the map →

What you can do with it

The whole private market on one map

A district heatmap shows where prices are moving, and each district opens onto its projects.

Search by project, street, postal code or HDB block, and layer MRT stations, schools, hawker centres and supermarkets.

Explore the map →

PSF on one yardstick

Since URA's 2023 GFA harmonisation, new launches no longer count spaces such as air-con ledges in a unit's area, so the same home shows a higher PSF than it would under the old rules.

Propviz restates older projects' PSF on the new basis, so a 2019 launch and a 2025 launch can be compared fairly.

Reported, older area rulesS$2,000 psf
Harmonised-equivalentS$2,105 psf
Illustration with the default 5% area adjustment. Every figure in Propviz is labelled with its basis.
How the adjustment works →

Screen the market in seconds

Filter every project by district, tenure, property type and more, and sort by what matters to you.

Pro adds 3- and 5-year growth, as columns, filters and sorts.

Open the screener →

Know what you're competing with

Every project comes with a five-question dossier: market momentum, where its price sits, supply pressure and who it rents to.

See the new launches and ECs competing for the same buyers nearby.

Find a project →

Plan an HDB upgrade from your own block

Resale evidence for your town and flat type, with your block's position worked out in your browser: your block, storey and flat size never reach our server.

See how many flats around you reach MOP each year, and save your plan to come back to.

Plan your upgrade →

Shortlist, compare, decide

Keep a shortlist and compare projects side by side, on the same measures.

It works without an account, and syncs to your account when you sign in.

Open your workspace →

Why you can trust it

Private projects
1,397
Districts
28
Private sales to
Sept 2026
HDB towns
26
HDB resales to
Oct 2026

Official sources, credited

Private transactions from URA, HDB resale prices from HDB, and location data from data.gov.sg.

Checked every day

An automated check runs every morning and loads whatever each source has published since.

Aggregates, never single sales

No individual transaction is shown. A project appears once it has five sales, and thin months are left out.

Your plan stays yours

The upgrade planner works out your block's position in your browser. A plan you save is encrypted before it's stored.

Propviz gives context, not financial advice: it doesn't tell you what to buy or when. Estimates are labelled as estimates. Read the methodology

Free to start. Pro when you're serious.

Free

S$0

The map, the screener and your shortlist, with an account to keep them.

Start free

Pro

The full history, growth and every nearby layer.

Go Pro

Everything in Free, plus

  • Project price history, month by monthFull history
  • 3- and 5-year growth, with filters and sortingIncluded
  • Project screener200 results
  • Competing new launches and ECs nearbyIncluded
  • Nearest schools, hawker centres and supermarketsIncluded
  • HDB flats reaching MOPFull horizon, with ECs
  • Your block's resale recordSince 2017
  • Saved upgrade plans10, with what's new
  • Shortlist100, synced
  • Saved screens100
FeatureNo accountFreePro
Market map, heatmap and searchIncludedIncludedIncluded
Project price history, month by monthLatest 12 monthsLatest 36 monthsFull history
3- and 5-year growth, with filters and sortingNot includedTrend signalIncluded
Project screener50 results100 results200 results
Competing new launches and ECs nearbyPreviewPreviewIncluded
Nearest MRT stationsIncludedIncludedIncluded
Nearest schools, hawker centres and supermarketsPreviewPreviewIncluded
Rental audience for each projectNot includedCoarse bandsCoarse bands
HDB flats reaching MOPNext 3 yearsNext 3 yearsFull horizon, with ECs
Your block's resale recordLatest 24 monthsLatest 24 monthsSince 2017
Saved upgrade plansNot included110, with what's new
ShortlistIn this browser10, synced100, synced
Saved screensNot included10100

Questions

Is this financial advice?

No. Propviz shows context from public data: prices, trends and what's nearby. It doesn't recommend what to buy or when, and estimates are labelled as estimates.

Where does the data come from?

Private residential transactions from URA, HDB resale prices from HDB, and amenity and location data from data.gov.sg. Propviz turns them into aggregates; the methodology page explains how.

How current is it?

An automated check runs every morning and loads whatever each source has published. Every chart shows the month its figures run to.

What does Pro cost, and can I cancel?

Your account page shows Pro's current price. You can manage or cancel it from your account page at any time.

Is my upgrade plan private?

Your block, storey and flat size are used in your browser and never sent to our server. Without an account, a plan stays in your browser; saved to your account, it's encrypted before it's stored.

The whole market, on one yardstick

Data: URA, HDB and data.gov.sg.